Hitting the ground running in a new organization is a huge challenge for a leader. We have to assess the overall health of the teams, the technical aspects of the job, the talent of the individuals, the organizational dynamics, and on and on. Whew!
What if I told you there is a simple way to build a tool that you can use throughout the first year to identify the hotspots and the people who will help you with them? There is.
The Challenge
When I started at SendGrid, I felt that it was important to meet with everybody in the department to understand what they, personally, struggled with and what they loved about the company. I figured it would help to uncover any hidden issues and would give me a great opportunity to build the relationships that would be needed when change got hard. Given that people are often less forthcoming in group meetings and relationships are harder for me to forge in those settings, I chose to meet with everybody individually. With about 90 people in the department at that point, this meant that even with 30 minute 1-1s, I was talking about 2-3 a day, every day, for a couple months.
Worth it.
The Questions
With only 1/2 hour, I had to be selective about what I asked. I chose to ask three pretty normal questions and one screwball. The normal questions:
- Tell me about yourself — your background, what you like to do for fun, etc. We typically spent 10 minutes on this both as an opportunity to get to know each other and also to identify connection points. SendGrid had some truly wonderful people.
- What do you love about SendGrid? In other words, what should I not mess with? It was heartening to hear how much people loved their co-workers.
- What gives you headaches? What should I be looking into in my first 90 days? Oh, my, did people hate the build system!
The screwball question:
- Let’s fast-forward into the future. You’ve had it! You’re done with SendGrid and walking out the door. <pause> I’m going to give you a gift. You get a lifeboat. You can take any three people from SendGrid with you to your next company. Who would you pick?
What did I learn from the lifeboat?
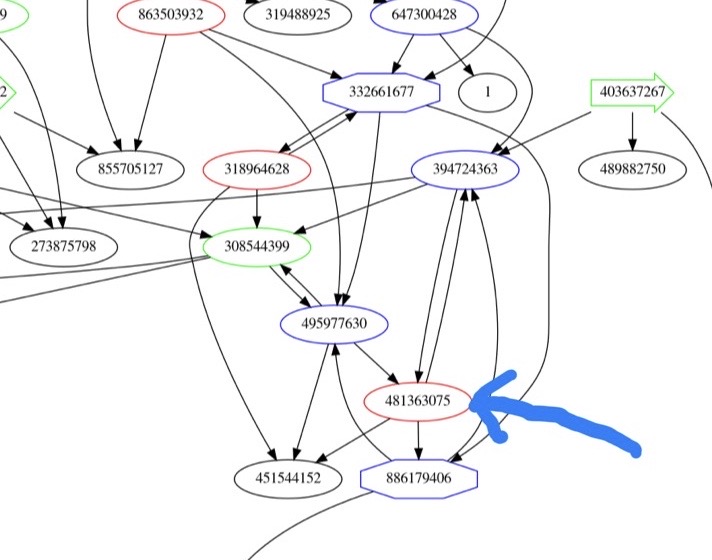
The lifeboat question, tracked as rows in an ever-growing spreadsheet quickly becomes overwhelming. It is helpful to transform the spreadsheet into a directed graph in order to visualize it. Practically, this is as simple as drawing an arrow (edge) from each person (node) to the three people they picked for their lifeboat.
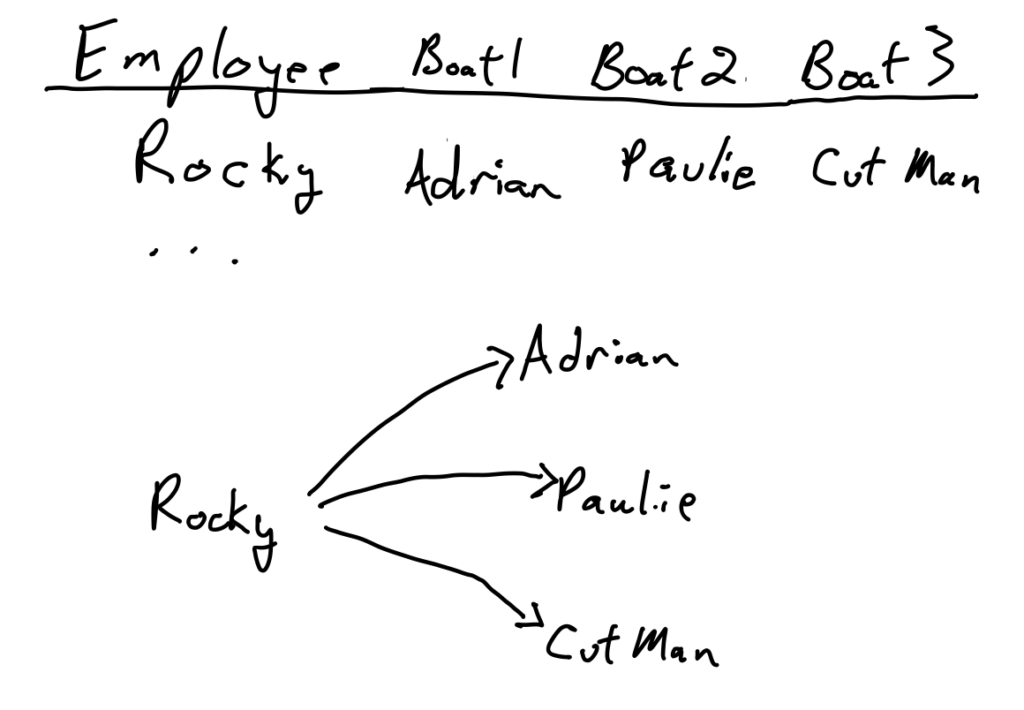
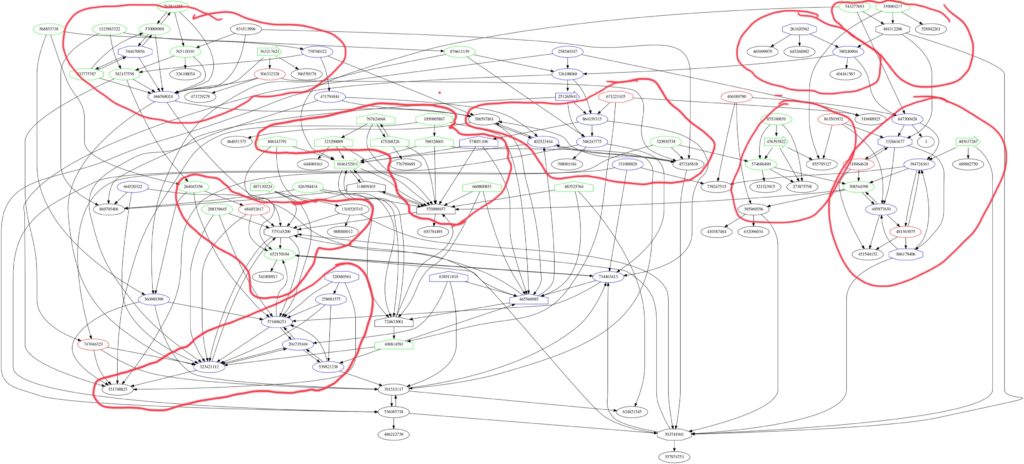
Drawing a graph with 90 nodes and 270 edges is too difficult for humans so I used (and would recommend) Graphviz to draw it for me. Here is an anonymized version of the actual graph from SendGrid Engineering. I like to think of it as a Respect Graph.

Key
Level: Junior (red), Mid-Level (green), Senior (blue), Lead (black)
Function: Program Management (arrow), Developer (oval), QA (octagon), Technical Operations (pentagon)
Know your stars
Let’s pull out some pieces of this to highlight a few of the observations we can glean.
The Collaborator

Odds are good that 575145200 is a star. The question is what kind of star? Knowing that developers are ovals and octagons are QA, this is a tester who has the respect of all the developers he works with — respect that is not easily given. If your instinct is that this is a person who makes their code better while managing to be highly collaborative, you’re spot on.
For the next type of stars it is helpful to make one general observation. People tend to put people who are on the same team in their lifeboats because they are the ones with whom they are most familiar. In this next image, I’ve circled the teams so you can see how strongly connected those sub-graphs are.
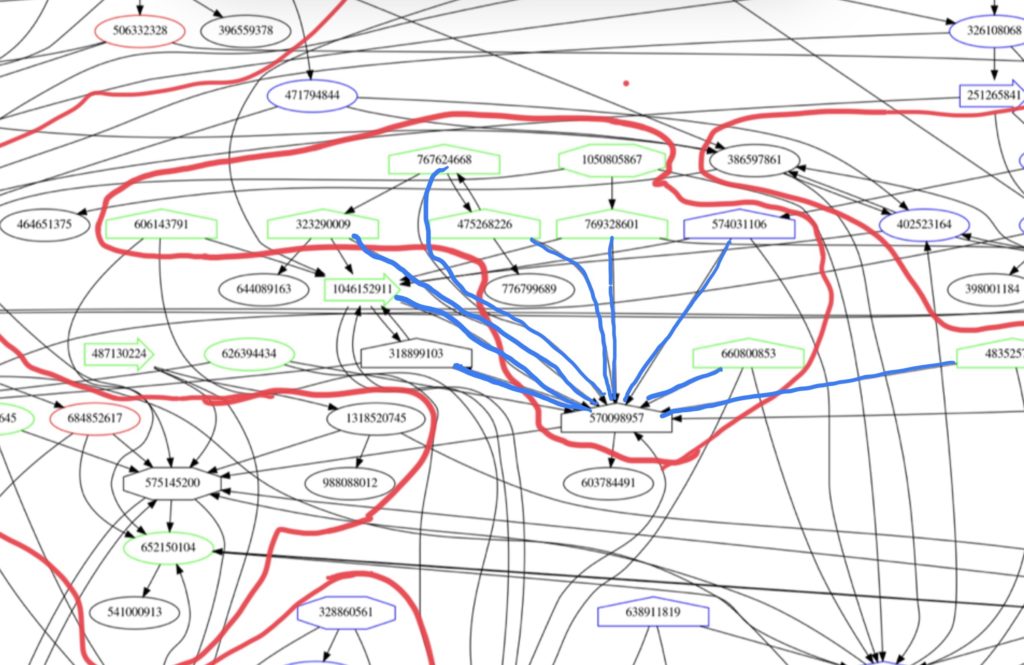
The Connector
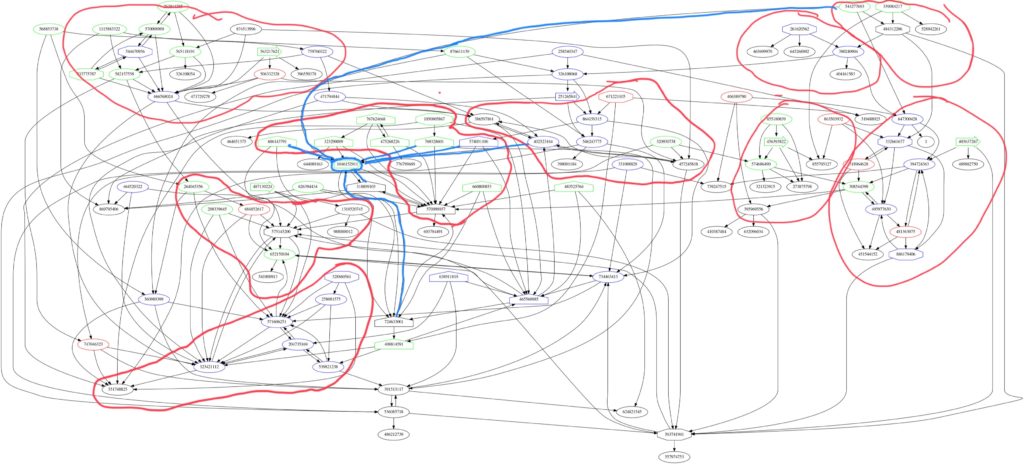
See how many teams had members who picked her for their lifeboats? This happened to be the case across both different technologies and geographies. This is a star who can be leveraged to help a person in need know who to go to regardless of where they are in the organization. The Connectors also form an informal communications network. If there are messages you need to have make their way across the organization but you cannot make them via formal announcement, these are the folks you want around.
The Firefighter
See how this senior person was chosen by every mid-level person anywhere near them but not by many outside that team? Either they are an exceptional inwardly focused mentor who you’ll want to have on a management path or they are the lone-wolf fire fighter who works while others stand in awe. (Hint: if they were an exceptional mentor, wouldn’t at least one of their teammates be valuable enough to be in somebody else’s lifeboat?) As your organization scales, this is a person you must help to share what they know with others. It might take arm-twisting but it needs to happen in order to spread that tribal knowledge.
The Rising Star
What’s so special about a person who is in two lifeboats? Remember that red is the color assigned to our most junior engineers. This person was selected by two separate senior engineers, out of all the people in the company they could take. Make sure these high potential juniors have a career path so that they can grow and learn in your organization. If you don’t, they will grow and learn in somebody else’s. (This person was promoted twice in the first three years of my tenure.)
Final remarks
There is so much more that a graph like this can tell the observant leader. Teams that work tightly together would show up via a lot of inter-connectivity. Are there teams that are supposed to work tightly together but don’t inter-connect? What would that mean? Are there senior folks on the same team who are in a large number of lifeboats? They’d be your first candidates to anchor new teams as you scale up. Rather than continue to enumerate all the possibilities, I’ll leave the rest as an exercise to you, the reader. What can you find in it? What should I have incorporated other than level and function?
May 14, 2020 at 5:04 am
It’s awesome you had the foresight to track the responses to get this kind of data. Do you think an anonymized survey (vs. 1:1’s) would yield significantly different results? This got me thinking about ways you could try to measure the health of teams during / after a reorganization.
It may have been information that was slightly more convoluted to gather but it would be interesting to have a data point on “time in seat” or “time on team” – how quickly (or not) they were on the boat of folks from that team, and if they had transferred from another team how many folks still had them in their boats. The level / seniority is relevant but some measurement of tenure at the company or team level would give some additional intersections that may be worthwhile.
May 14, 2020 at 9:10 pm
I think an anonymous survey would not have been filled out by most people. Aside from the one person who put me in their lifeboat, I have no reason to question the validity of the data. What kept me from doing it on an ongoing basis was the amount of time it would have taken. It is possible that it could be made a standard question at performance review time and so could be delegated. That’d allow you to track things like your suggesting.
Yes, I can see the value of tenure as another variable. It could help identify camps (old guard vs. new guard), how quickly somebody proves themselves, current performance vs. reputation (new folks could be more objective), etc.
May 14, 2020 at 10:08 pm
Fantastic to see the graph. I remember you asking this question and I thought it was brilliant. Ever since then, I knew that if I found myself in a leadership position in a new org that I would borrow the strategy. This visualization is a fantastic way to organize the data!